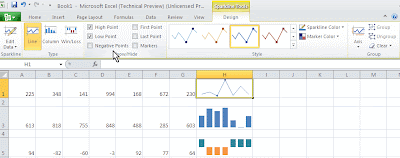
Sparklines is a graph display of the collection of data in Microsoft Office Excel, but displayed only in one cell.
To make it, you are required to have a set of data, just as if you want to create an other graph. Click on the Insert ribbon menu, and select the desired type sparkline. And as usual, you are prompted to set the data that you show with this sparkline graph, and finally determine the cell where you want to display these sparkline.
Especially for type Win / Loss, sparkline this type is used if you have a set of data in which there is a negative number.
And as usual, you sparkline graph can be modified in appearance, ranging from about the color until the value to be displayed.


No comments:
Post a Comment